 Image: Google/Natascha Eibl
With manufacturers again shipping Meltdown and Spectre updates to fix security exploits in CPUs, you may be wondering just how much of a hit your PC has taken.
After testing how much the updates affected older PCs and my own Surface Book performance laptop, and studying the benchmarks run by colleagues at Techspot and PCMag as well, we believe we’ve found a simple way for the average consumer to gauge the slowdown.
 IDG
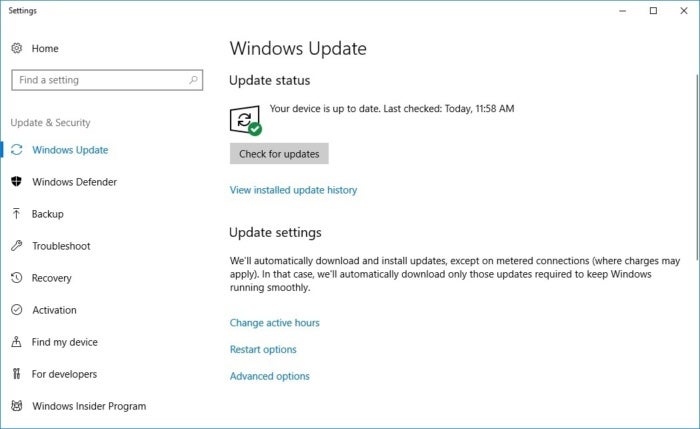
IDGMake sure you have all of the latest updates for Windows installed.
Step 1: Make sure your PC is updated
Make sure your PC is updated with the latest patches for Meltdown and Spectre. If you need more details on how to do this you can read our story on how to protect yourself from Meltdown/Spectre.
To verify your status, we recommend that you download and run Gibson Research’s free InSpectre utility, which can verify that your machine is updated and fully patched. The utility has already been updated multiple times, so make sure to snag the latest version (Release 6, as of this writing). The ideal result with Release 6 should be “yes” (as in, yes, your PC is protected) for both Meltdown and Spectre.
 IDG
IDGMaxon’s free Cinebench R15 comes in a zip file containing thousands of files. We’ll use this to do some of our testing.
Step 2: Gather your materials
There are two small files you’ll need for various tests. Both are free.
We recommend using the free Cinebench R15.038 benchmark, which you can download directly from Maxon.
The second benchmark file is CrystalDiskMark 6, which functions as a good second opinion following Cinebench.
 IDG
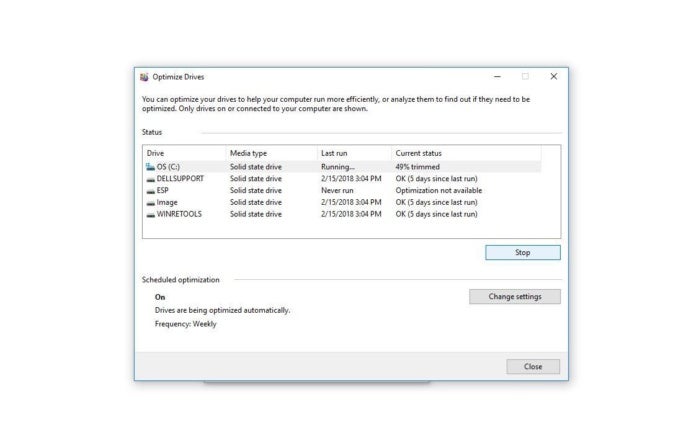
IDGYou should “trim” the SSD on the system you’re about to test by using the Optimize command from Windows 10. This orders the drive to erase cells marked for deletion and will aid in more uniform results.
Step 3: Prep your PC
Before you do any performance testing, you should take your computer offline to prevent Windows from interfering with results by deciding to download a massive update. If you’re on Wi-Fi, set your PC to Airplane Mode via the networking section in Windows Settings. If you’re on Ethernet, just disconnect the cable from the PC.
A lot of the performance problems with Meltdown and Spectre crop up in disk access. If you’re using a hard drive, you can relax a little: You’re unlikely to notice any impact simply because hard drives are already slow. But if you’re using an SSD, you will notice if it starts to drag, and these benchmarks will prove it.
We recommend that you TRIM the SSD before doing any testing. In File Explorer, double-click This PC to show the main folders on your computer. Right-click the icon symbolizing the primary OS drive (usually C:) and click Properties. Select the Tools tab in the dialog box and click Optimize. This will order the SSD to perform housekeeping tasks such as erasing blocks on the SSD that had been previously marked for deletion. Note that SSDs typically only perform house cleaning tasks when they’re idle; let the computer sit for five or so minutes so the SSD will actually invoke the trim command.
After the TRIM is done, reboot the computer. When the Windows desktop appears, wait several minutes for the OS to settle down before doing any testing.
 IDG
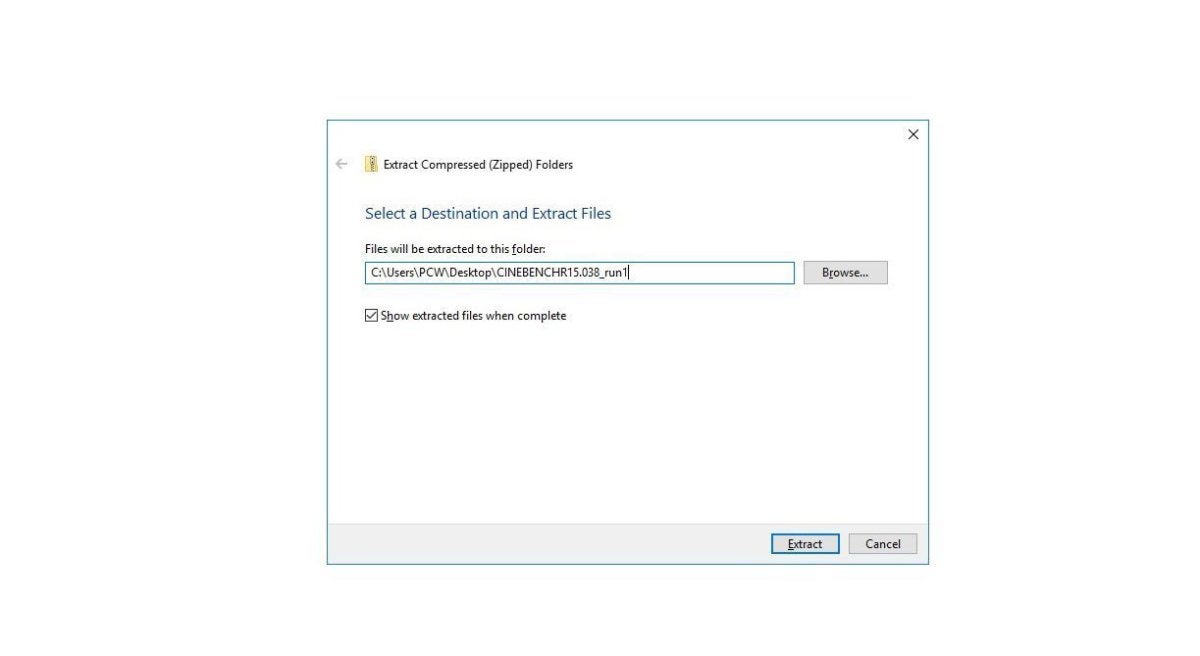
IDGRight-click on the file, and use the Windows built-in extraction support. Remember to rename the folder for each run.
Step 5: Run the test
The first test is quite simple and effective: Just use Windows 10’s built-in decompression tool to unzip the Cinebench Zip file you downloaded. Cinebench R15 is an 82MB Zip file that decompresses to 202MB with 2,516 files in 126 folders. That sounds like a lot of files but is pretty typical for an application, so consider it a very real test.
Rather than deleting the folder for each run, we recommend that you simply decompress the file into a new folder on the desktop for each run. This should give you more stable results. Use a stopwatch to time each run and wait a few minutes in between runs to let the machine settle. When done, take an average of all three runs.
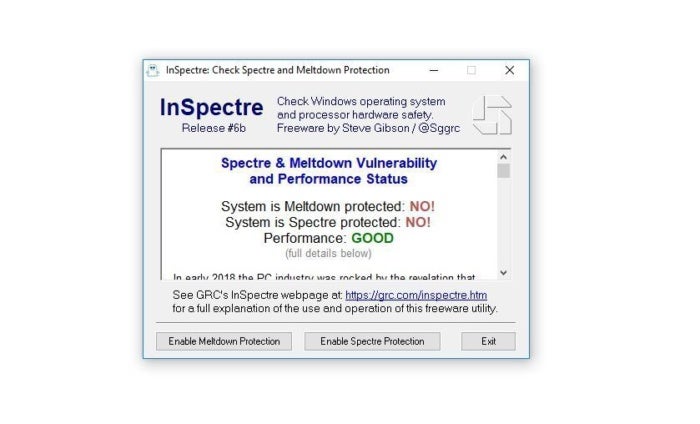
Now run InSpectre by right-clicking it and running as Administrator. You can now disable Spectre and Meltdown protection by clicking the disable buttons at the bottom of the window (or enable it once you’re done).
 IDG
IDGYou can use GRC’s InSpectre to toggle off Meltdown and Spectre updates in the OS.
Once you have enabled it or disabled it, reboot the machine, wait several minutes for it to settle, and re-run your tests.
Most of the testing we’ve done in benchmarks shows the biggest impact to be in anything that touches the disk heavily. The performance hit in Cinebench shows up in the simple act of decompressing all those files. The result is, however, very much dependent on the CPU. and likely the SSD too.
Step 6: Analyzing the results
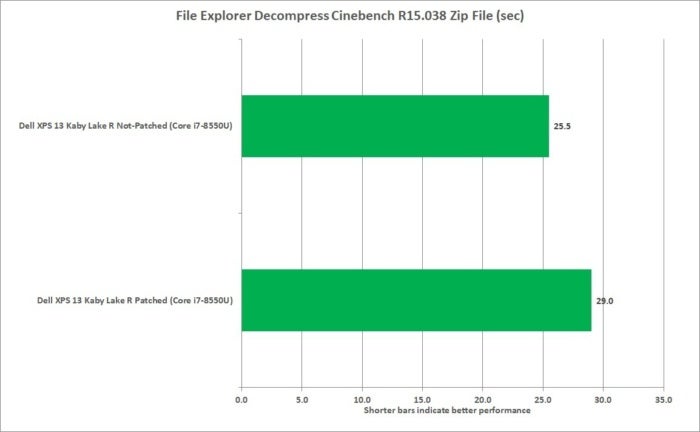
On a Broadwell-based laptop with SATA-based M.2 SSDs, we’ve seen 30-percent swings in performance from patching. The hit isn’t quite as big on a Kaby Lake R-based laptop with an NVMe M.2 SSD, but still noteworthy at 14 percent.
 IDG
IDGThe performance hit isn’t quite as bad with a Core i7-8550U and a Toshiba XG5 NVME SSD as it is with a Core i5-5200U and SATA M.2 drive.
Are there other ways to see how much it hurts? For one thing, with Cinebench R15, you can now measure the CPU performance before and after the patch. Start the benchmark and click the Run button next to the CPU button on the upper-lefthand side. It will produce a test of how fast the particular system can render a 3D image using all of the cores.
Be careful not to draw too many conclusions, though. Cinebench R15 and most CPU-centric tests can vary based on the temperature of the CPU. In fact, some new laptops will also vary performance based on micro-vibrations they sense—so don’t test it on your lap. On a desktop with good cooling, the variance should be far less.
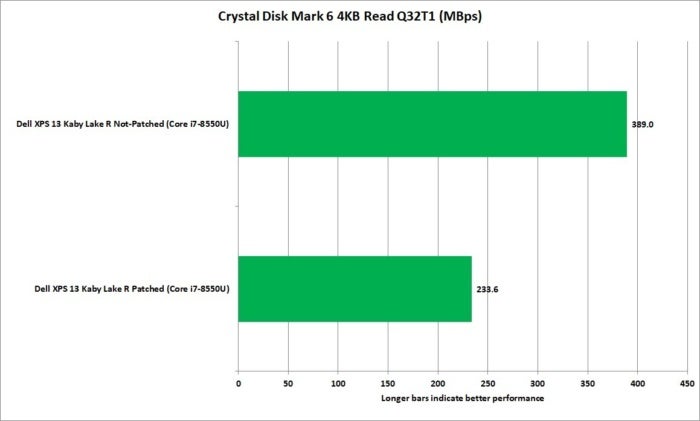
Most of the testing of consumer workloads generally puts puts the impact to at 3 to 5 percent. The biggest hit is still clearly in disk I/O, which can crop up in any application or game. You can see direct evidence of this by using CrystalDiskMark 6.0. This is a benchmark built on an engine Microsoft uses to measure server disk performance. To run CrystalDiskMark 6.0, install it by running the executable and then click the All Button. If all you want to see is performance on small files with a queue depth of 32 and a single thread, click the 4KiB Q32T1 button .
 IDG
IDGCrystal Disk Mark 6 shows the large impact from the Meltdown and Spectre fix on an Intel Core i7-8550U chip.
We’ve seen similar small file performance hits in other disk tools as well, so we think this is representative of the worst-case scenario.
The “we’re still standing soaking in the rain” part of this is that you took a hit at all. The silver lining is the Kaby Lake R CPU with a fast NVMe drive doesn’t suffer quite as bad a hit as older platforms do. Even a 14 percent performance decrease isn’t anything to celebrate, though.


